eBPF: From Kernel to Cloud, Episode 14
What Is eBPF? · The BPF Verifier · eBPF vs Kernel Modules · eBPF Program Types · eBPF Maps · CO-RE and libbpf · XDP · TC eBPF · bpftrace · Network Flow Observability · DNS Observability · LSM and Tetragon · Process Lineage · The Audit Playbook
TL;DR
- You can audit eBPF programs on any Kubernetes cluster with four
bpftoolcommands, regardless of which vendor’s tool loaded them —prog show,map show,net show(pluscgroup tree), andprog dump xlated
(bpftool = the kernel-shipped CLI for inspecting loaded eBPF programs and maps directly, independent of any userspace agent or vendor tooling) bpftool prog showgives you the inventory: every loaded program, its type, and — via its pinned path — usually which tool owns itbpftool map showgives you the state: what data each program is reading or writing, cross-referenced by themap_idsfrom the first commandbpftool net showandbpftool cgroup treegive you the attachment points: which interface, which qdisc, which cgroup hook — where enforcement actually happensbpftool prog dump xlatedgives you the behavior: what the program does at the instruction level, for the cases where the pinned path doesn’t tell you enough- This sequence works whether the cluster is running Cilium, Falco, Tetragon, a hand-rolled XDP filter, or something with no documentation at all — the kernel doesn’t care who loaded the program
You inherit a cluster with no runbook, no README, and no answer to “what’s making the policy decisions.” Something on these nodes is dropping packets, or blocking execs, or both — and you have about ten minutes before the incident call starts. kubectl get pods -A tells you nothing; whatever this is doesn’t run as a normal pod workload you can just describe.
Quick Check: Is Anything Actually Loaded on This Node?
# On any cluster node — count loaded eBPF programs
bpftool prog show | wc -l

# Expected output (a cluster running Cilium + Tetragon):
# 47
# Break it down by program type
bpftool prog show | grep -oE '^\S+:\s+\K\S+' 2>/dev/null || \
bpftool prog show -j | jq -r '.[].type' | sort | uniq -c
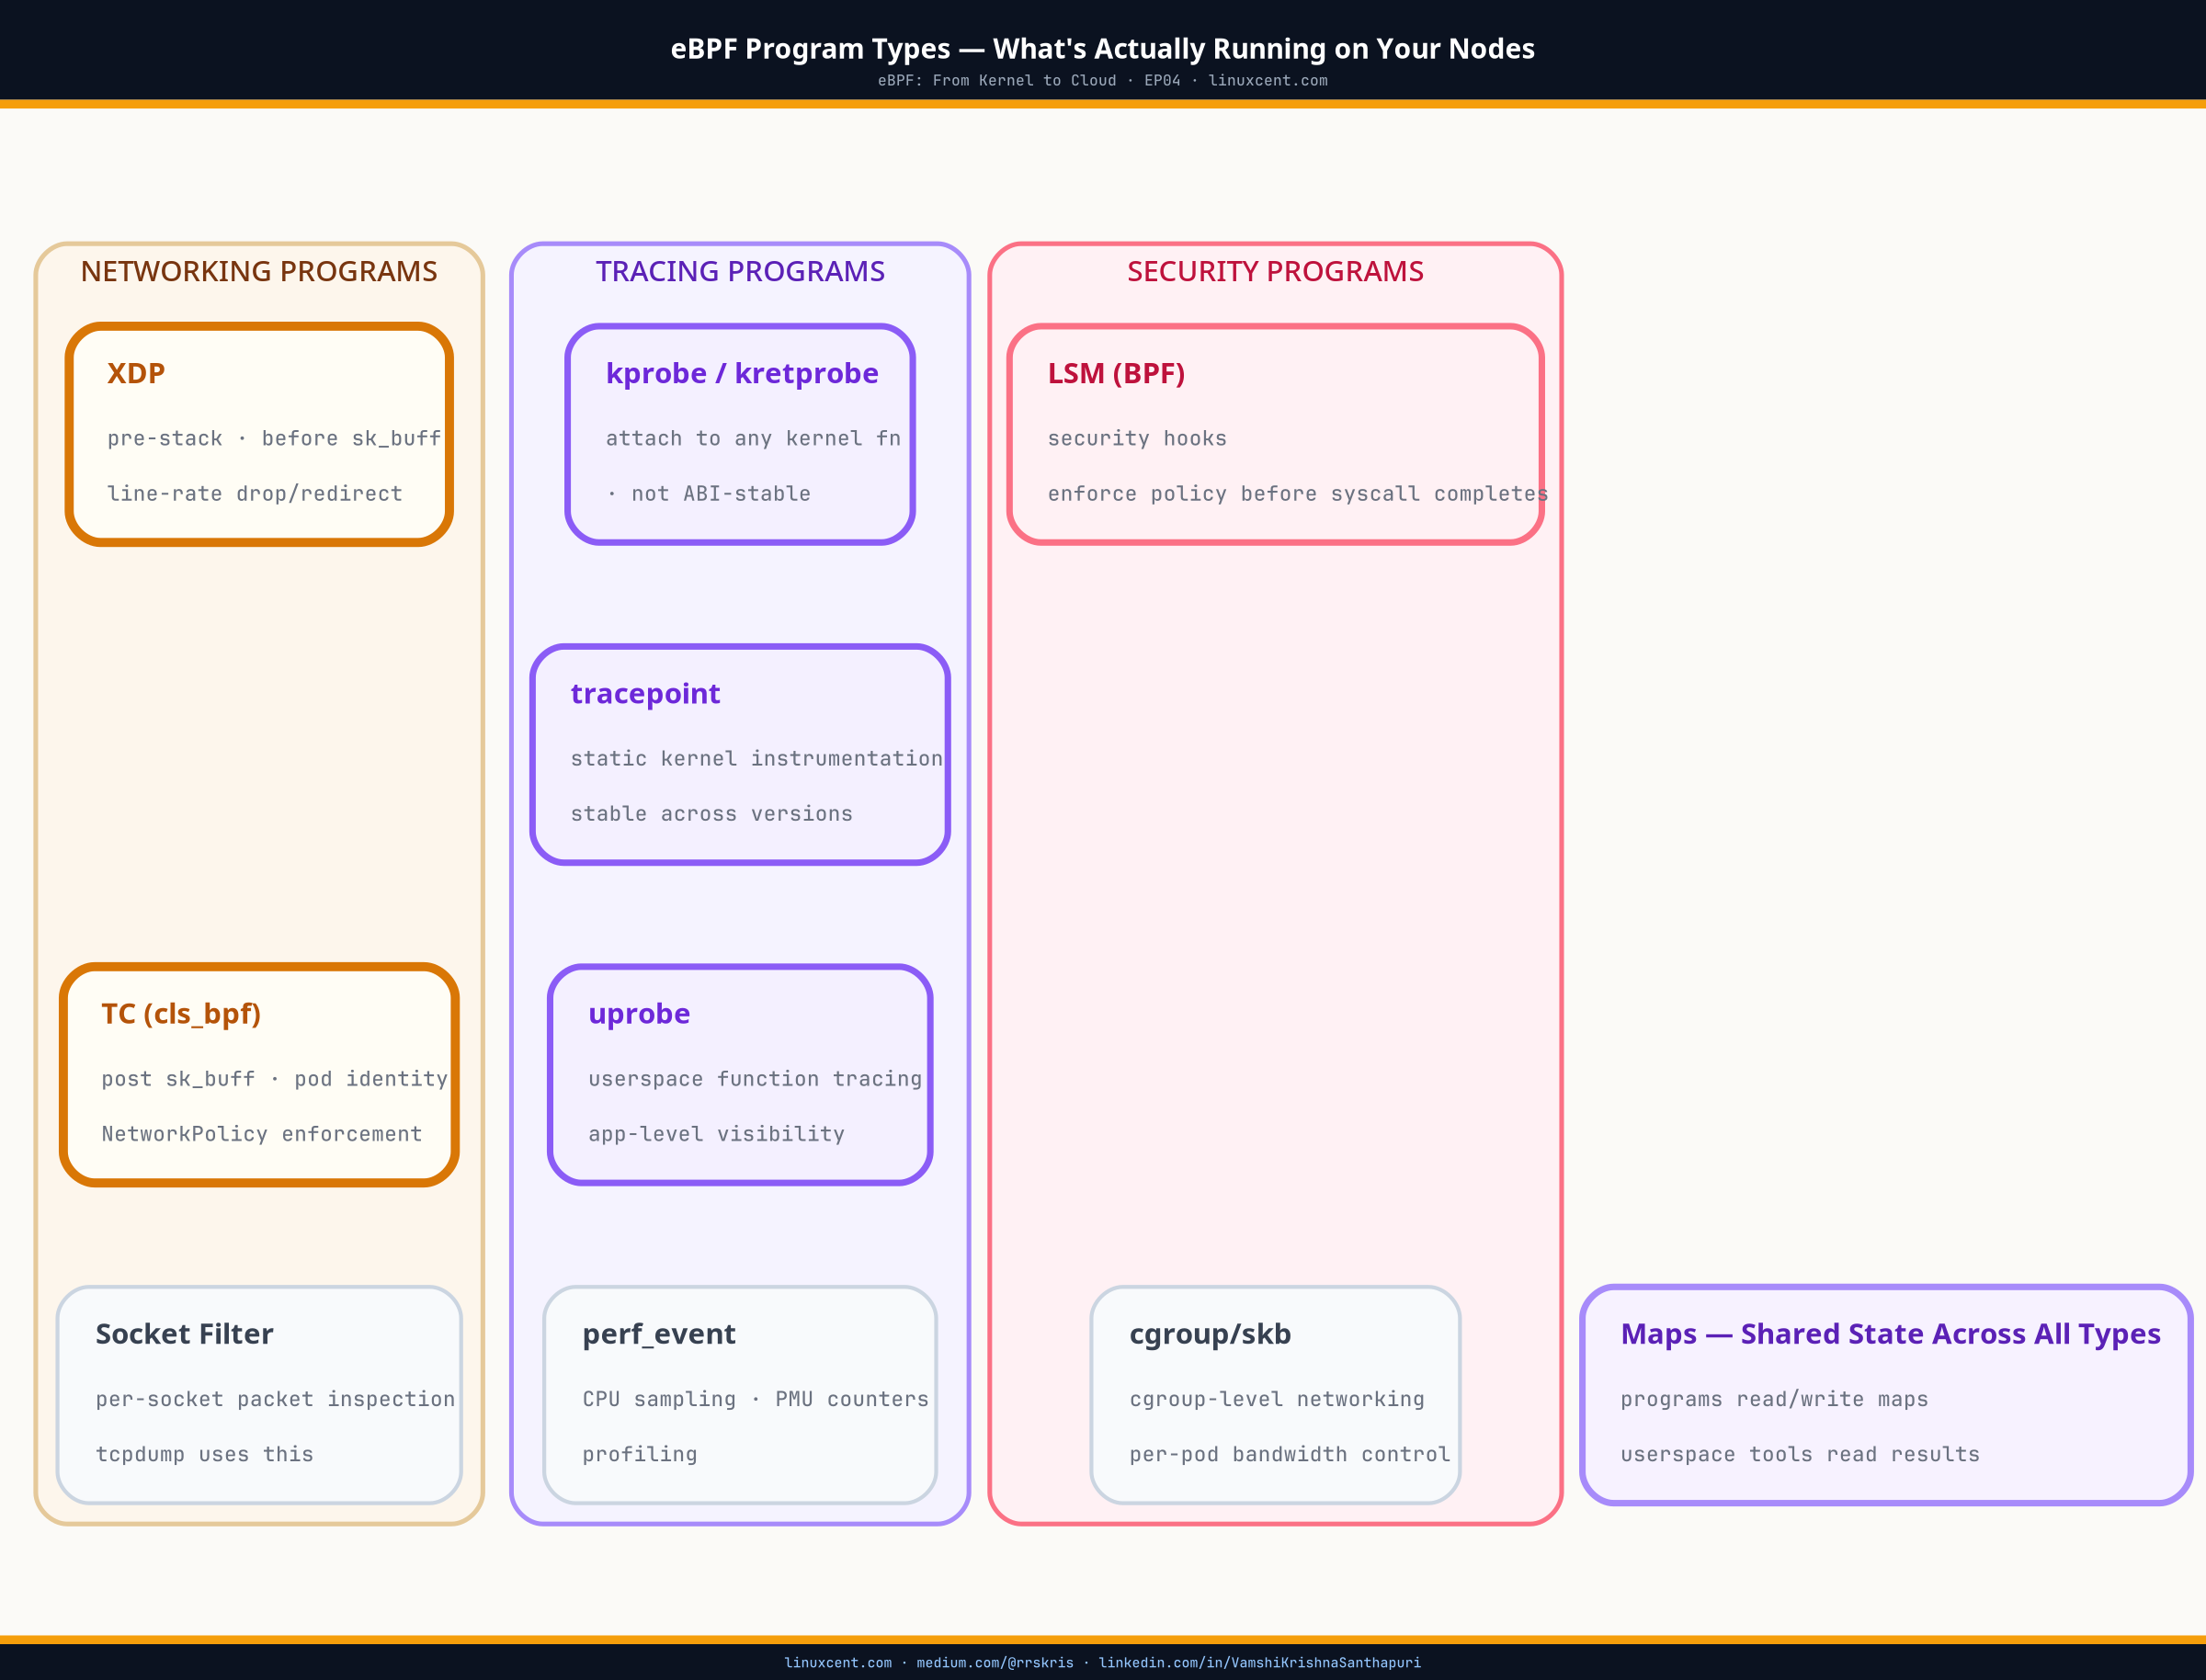
# 12 cgroup_skb ← Cilium's per-cgroup socket filtering
# 8 sched_cls ← TC programs (Cilium's netdev enforcement, from EP08)
# 6 kprobe ← Tetragon's syscall hooks (from EP12)
# 4 tracepoint ← process/exec tracing (from EP13)
# 2 xdp ← XDP fast-path filtering (from EP07)
Not running Cilium or Tetragon? On EKS or GKE? The count won’t be zero even on a “vanilla” managed cluster — kube-proxy’s eBPF mode (if enabled), the CNI’s own eBPF datapath, and any sidecar-less service mesh all load programs. A count of zero on a production node is itself worth investigating; it usually means you’re looking at a node pool that hasn’t finished bootstrapping, or
bpftoolis running in a mount namespace that can’t see the host’s BPF filesystem.
Forty-seven loaded programs and no idea which ones matter. That’s the audit playbook’s job: turn “something is loaded” into “here is exactly what it is, what it holds, where it enforces, and what it does” — four commands, in order, no vendor documentation required.
Command 1: Inventory — What’s Loaded, and Who Owns It
bpftool prog show lists every eBPF program currently loaded into the kernel on that node, regardless of which process or tool loaded it. The kernel tracks programs independently of the userspace agent that created them — the program keeps running even if that agent’s pod is deleted.
bpftool prog show
6: cgroup_skb  tag 6deef7357e7b4530  gpl
    loaded_at 2026-06-02T03:14:22+0000  uid 0
    xlated 296B  jited 187B  memlock 4096B  map_ids 4,5
142: sched_cls  name cil_from_netdev  tag a04f5eef06a7f555  gpl
    loaded_at 2026-06-02T03:15:01+0000  uid 0
    xlated 12664B  jited 7532B  memlock 16384B  map_ids 9,10,11,14
    pinned /sys/fs/bpf/tc/globals/cil_from_netdev
201: kprobe  name generic_kprobe_e  tag 88df3d0a1c9e2b41  gpl
    loaded_at 2026-06-02T04:02:18+0000  uid 0
    xlated 3184B  jited 1980B  memlock 8192B  map_ids 22,23
    pinned /sys/fs/bpf/tetragon/generic_kprobe_e
Program
tag— a SHA hash of the program’s instruction stream, computed by the kernel at load time. Two programs with the same tag are running byte-identical bytecode, even if they were loaded by different processes or have different names. It’s how you confirm two clusters are actually running the same version of a security tool without comparing source.Pinned path — a program pinned to
/sys/fs/bpf/...survives after the process that loaded it exits, because the reference is held by a file in the in-kernel BPF filesystem instead of by an open file descriptor in a running process. Most production tools pin their programs; ad hoc programs loaded by a one-off script usually don’t, and disappear the moment that script’s process exits.
The pinned field is doing most of the audit work here. /sys/fs/bpf/tc/globals/... is Cilium’s convention. /sys/fs/bpf/tetragon/... is Tetragon’s. Falco’s kernel-module and eBPF probe modes typically pin under /sys/fs/bpf/falco*. A program with no pinned line at all was loaded without a persistent reference — worth asking what process is holding its file descriptor open, because if that process dies, the program unloads.
For operators (not writing eBPF): if a security tool’s DaemonSet pod restarts and its programs don’t reappear in
bpftool prog showafter the container comes back up, that’s a real signal — the tool failed to re-pin or re-attach, and you’re running with a gap in coverage even though the pod showsRunning. This is a more reliable health check than the pod’s own readiness probe, which usually only checks that the userspace agent process is alive.
Command 2: State — What Data These Programs Are Keeping
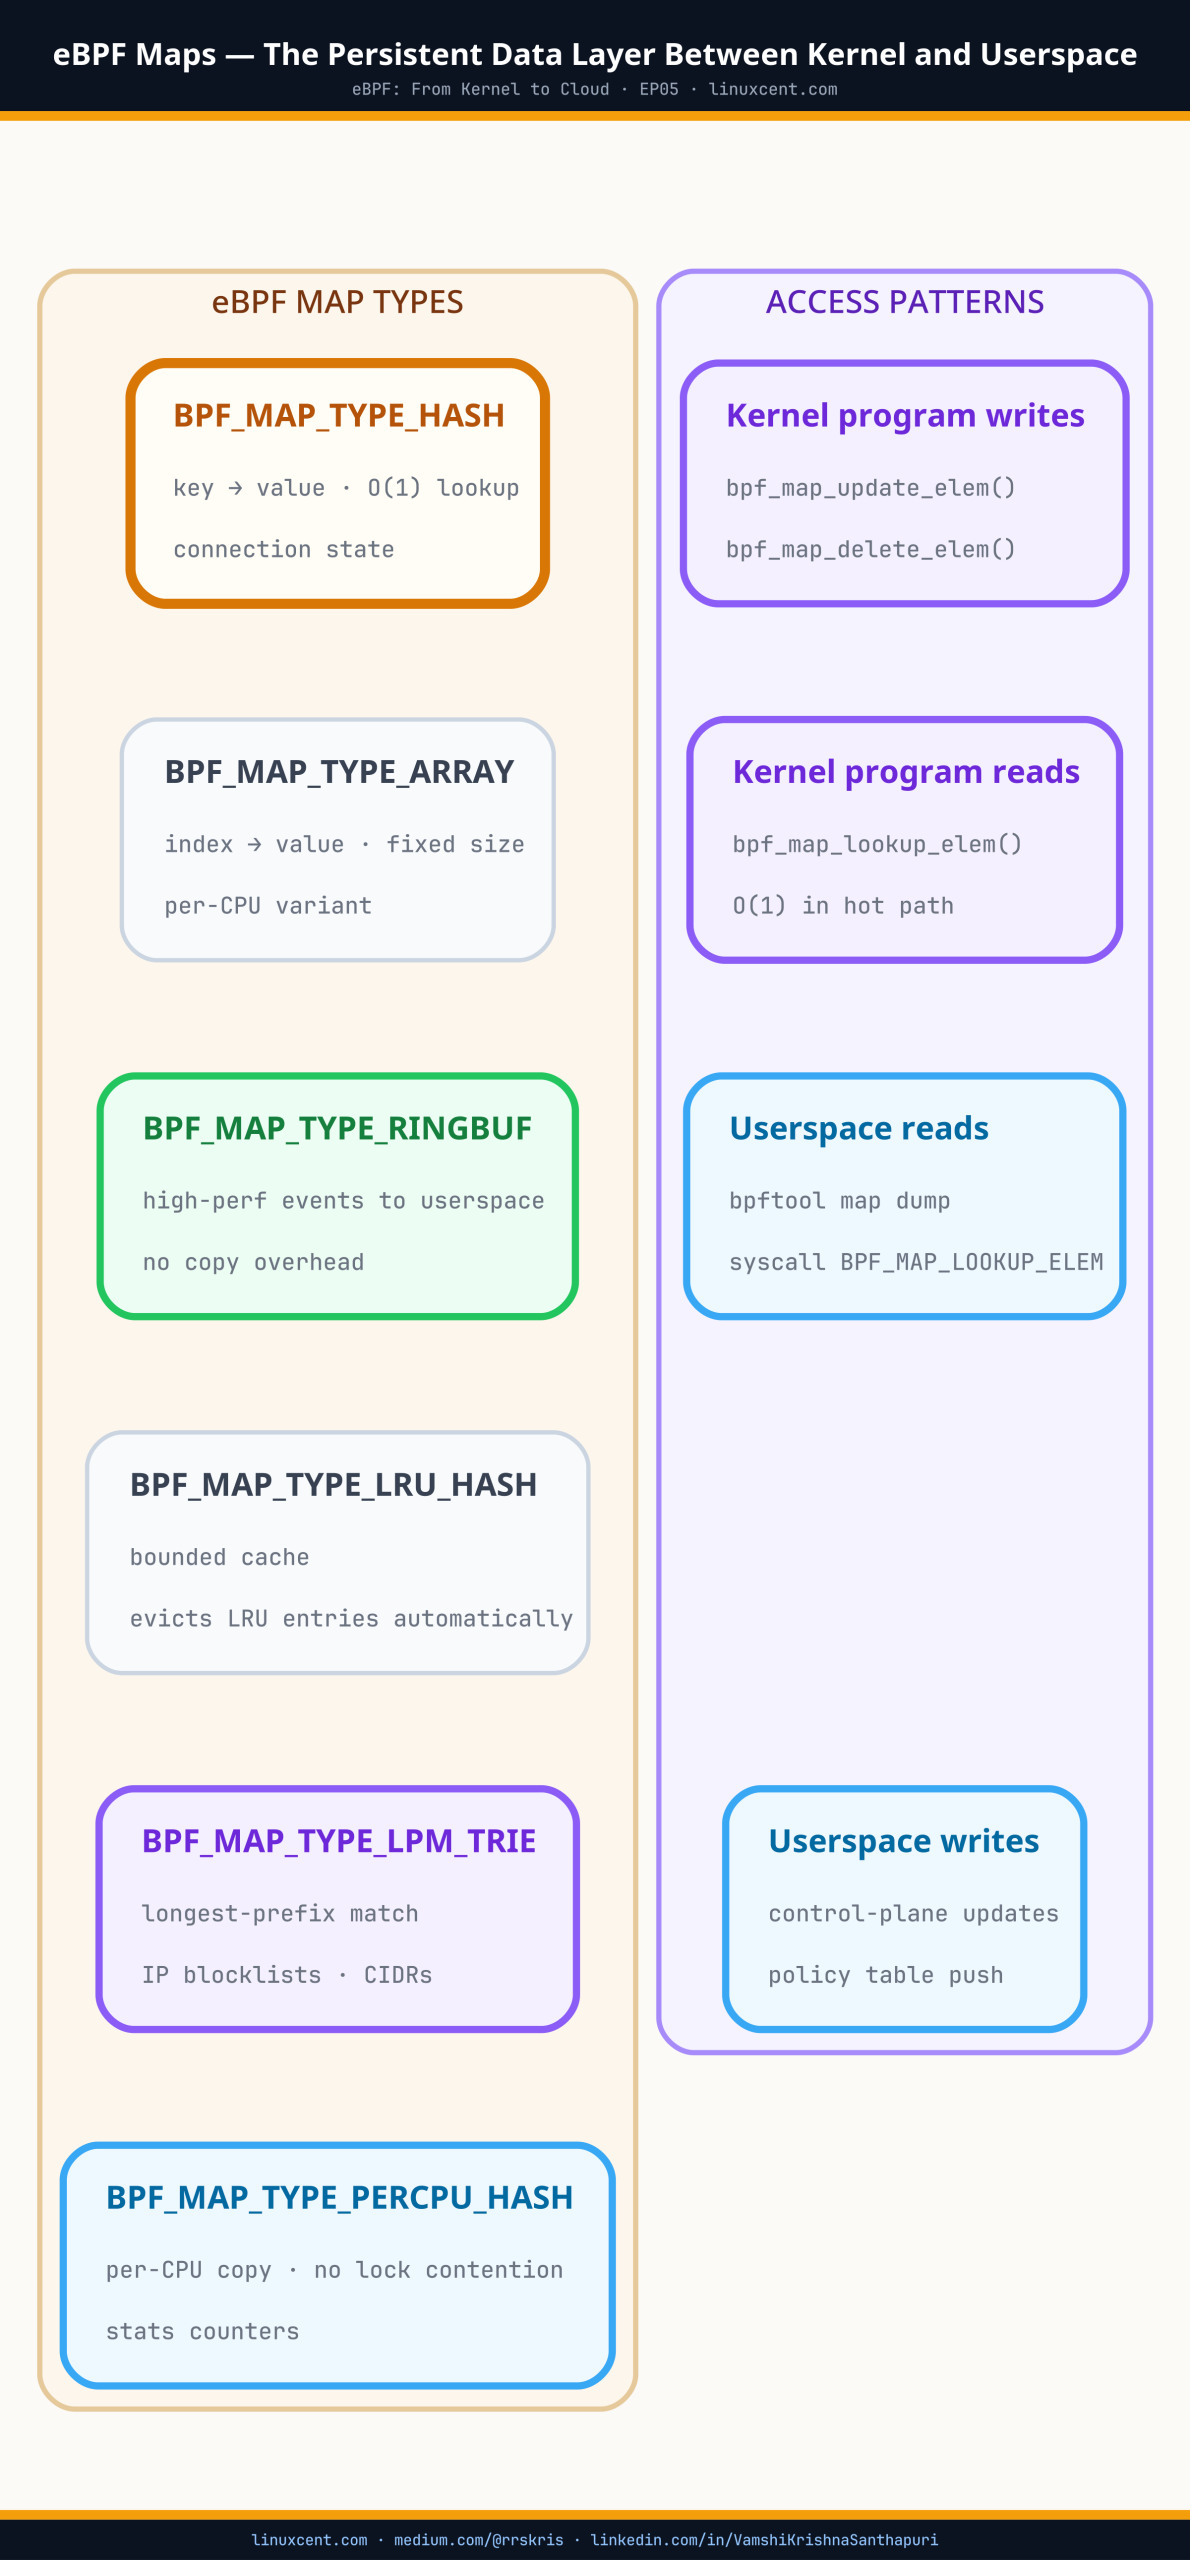
Every map_ids value in the prog show output points at a BPF map — the persistent, kernel-resident data structure the program reads or writes on every invocation (see eBPF Maps for how these work). bpftool map show inventories them the same way.
bpftool map show id 9
9: hash  name cilium_lb4_service  flags 0x0
    key 8B  value 24B  max_entries 65536  memlock 6291456B
bpftool map show id 22
22: lru_hash  name tg_execve_map  flags 0x0
    key 4B  value 128B  max_entries 32768  memlock 12582912B
    pinned /sys/fs/bpf/tetragon/tg_execve_map
Map ID 9 is a service load-balancer table — 65,536 entries, keyed by a service identifier. Map ID 22 is Tetragon’s exec cache (the same process-tracking structure covered in process lineage reconstruction), an LRU hash that evicts its oldest entries once 32,768 processes have been tracked.
The name field alone often tells you what the map is for — cilium_lb4_service, tg_execve_map — because most production tools name their maps descriptively rather than leaving them anonymous. When a map has no descriptive name, dump a few entries and read the shape of the data:
bpftool map dump id 9 | head -5
key: 0a 00 00 01 00 00 00 50 value: c0 a8 01 0a 00 00 00 50 00 00 00 01 ...
Raw bytes without a BTF type description are harder to read, but the sizes still tell you something: an 8-byte key and 24-byte value, repeated 65,536 times, is a fixed-size lookup table — consistent with a service or connection map, not a log or event buffer.
Command 3: Attachment — Where Enforcement Actually Happens
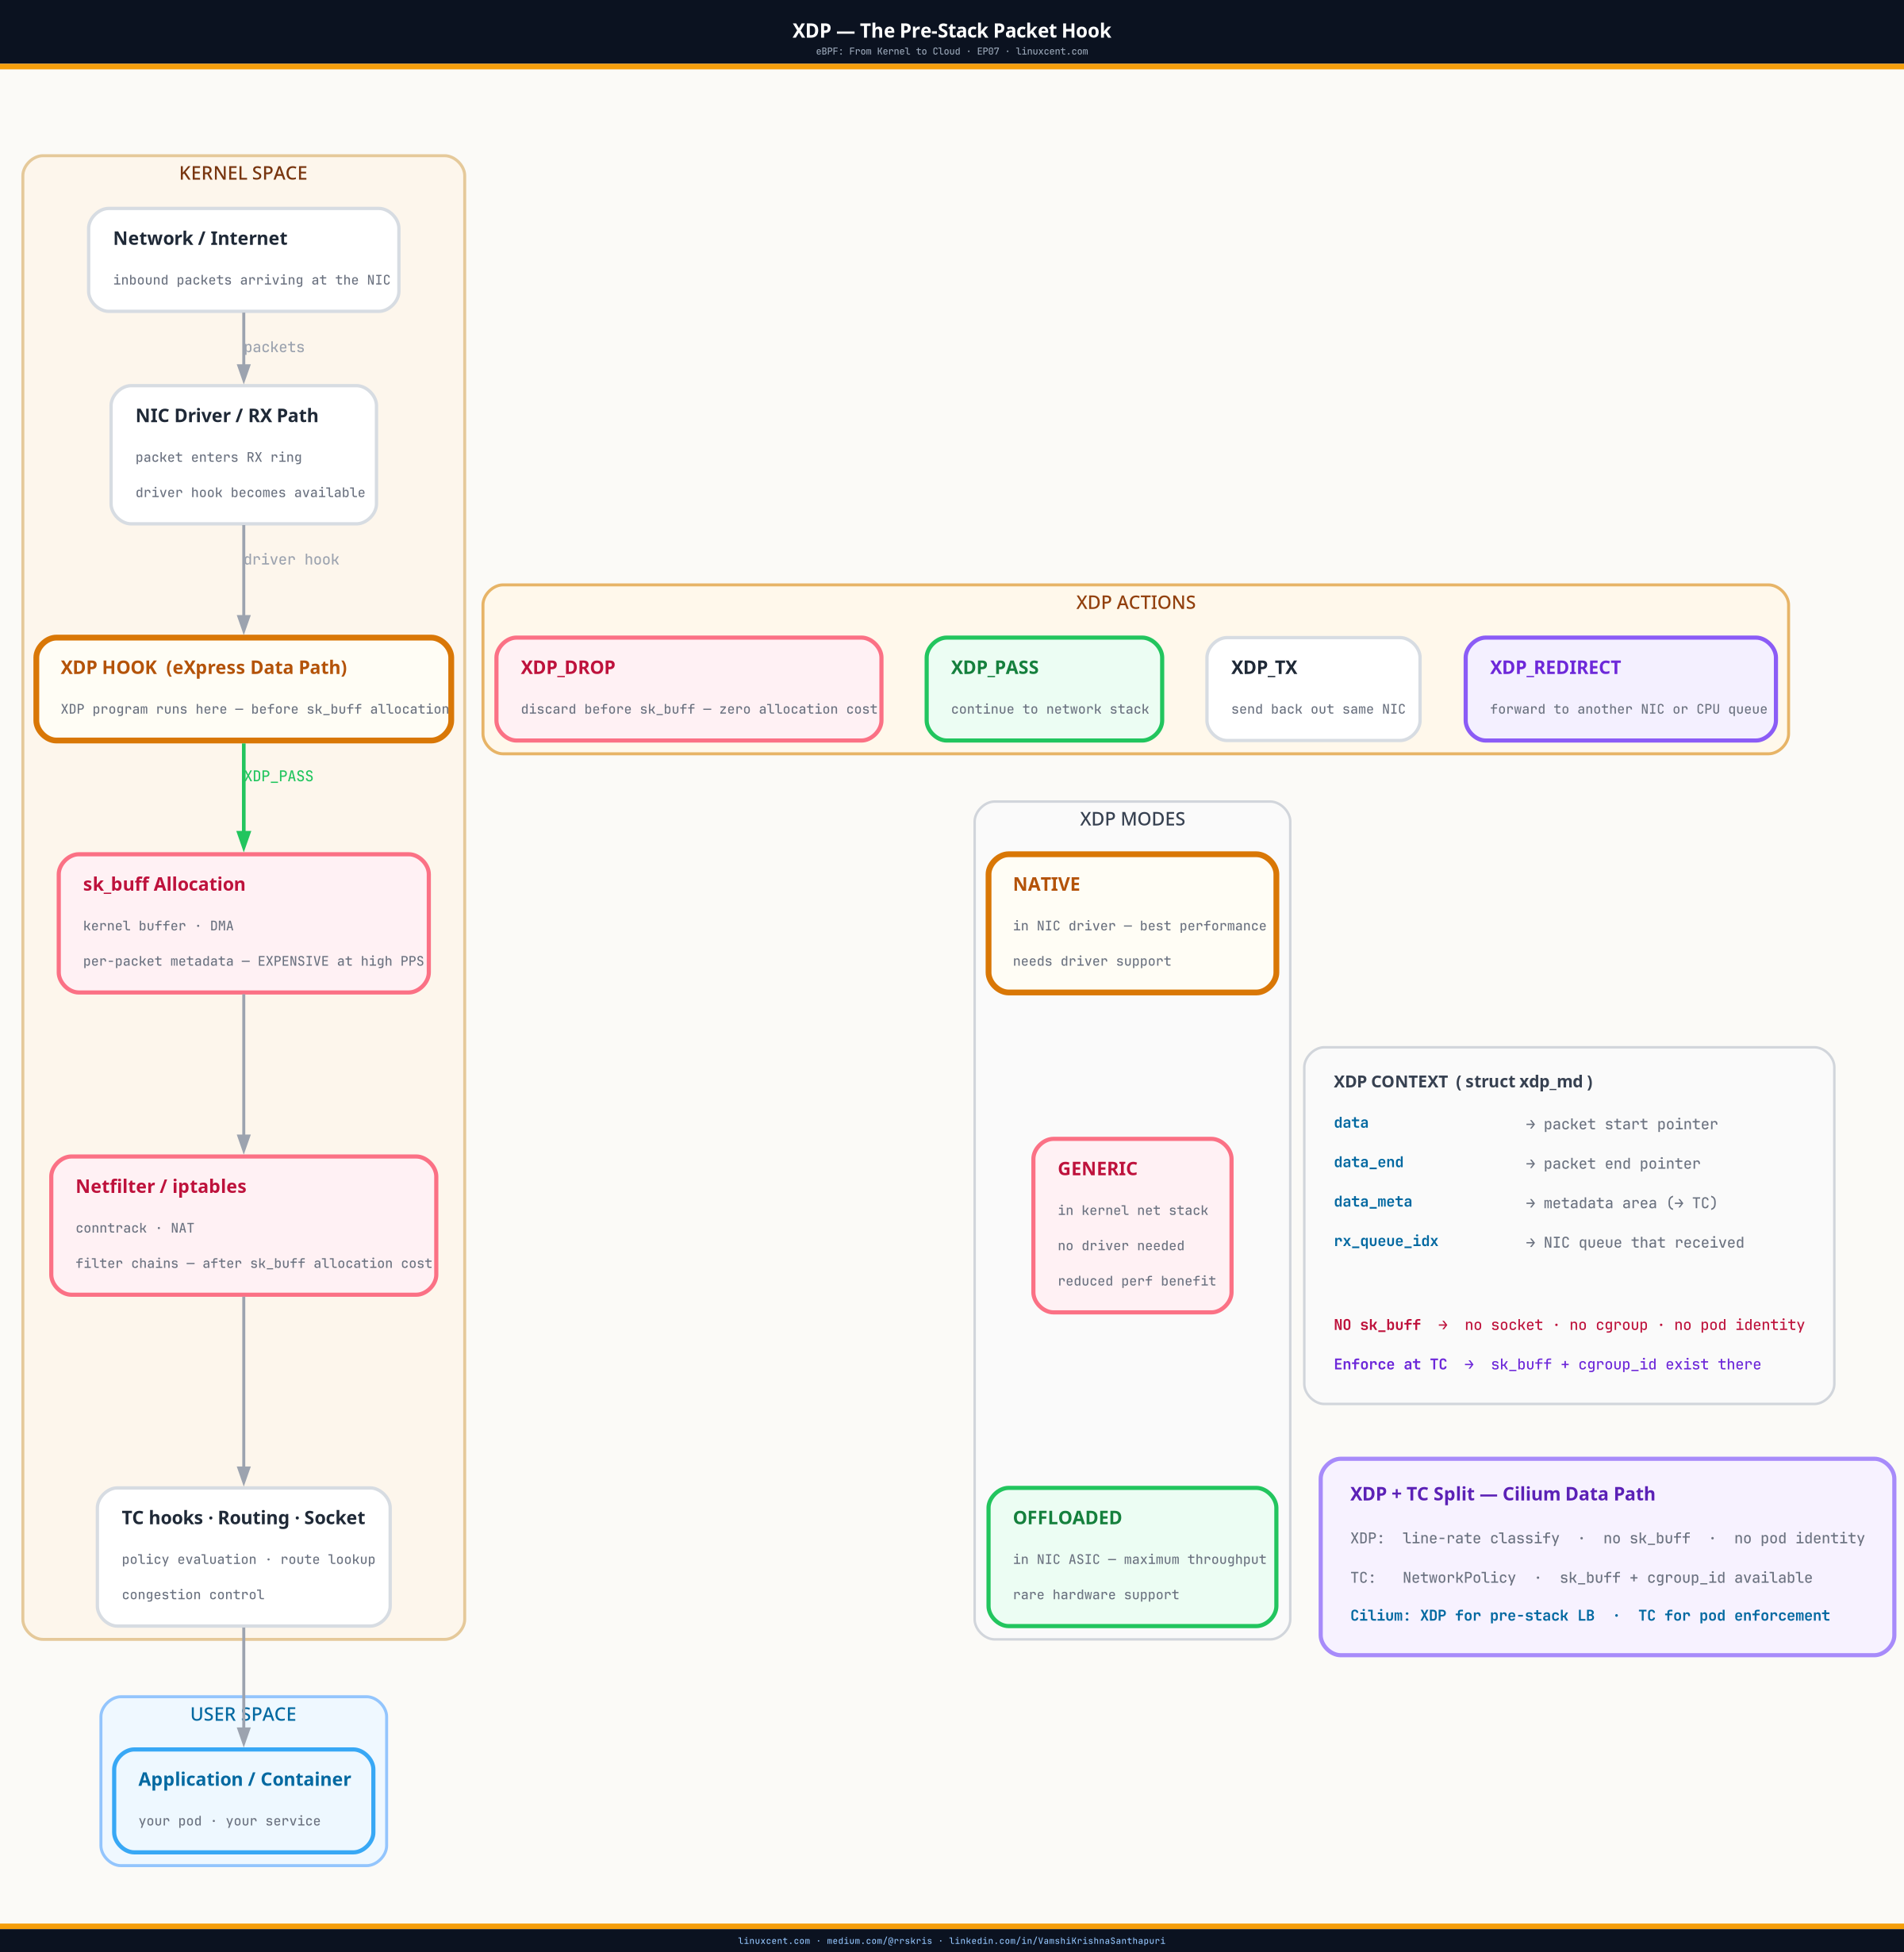
Inventory and state tell you what’s loaded and what it remembers. They don’t tell you where in the packet or syscall path the program actually runs. bpftool net show answers that for network-attached programs (XDP and TC, from EP07 and EP08); bpftool cgroup tree answers it for cgroup-attached programs (socket and syscall hooks).
bpftool net show
xdp:
eth0(2) driver id 88 tag 3b185187f1855c4c

tc:
eth0(2) clsact/ingress cil_from_netdev id 142
eth0(2) clsact/egress cil_to_netdev id 143
bpftool cgroup tree
CgroupPath
ID       AttachType      AttachFlags     Name
/sys/fs/cgroup
         6        cgroup_skb      multi
        18        cgroup_sock_addr multi           cil_sock4_connect
Program ID 142 — the same cil_from_netdev you saw in the prog show output — is attached to eth0‘s ingress clsact qdisc. That’s a direct answer to “is something making kernel-level policy decisions on this interface”: yes, at TC ingress, before the packet reaches any userspace process. Program ID 6 (cgroup_skb) is attached at the root cgroup with multi flags, meaning it stacks with other programs there rather than replacing them — the enforcement isn’t exclusive to one tool.
multivs exclusive attach flags: cgroup and TC attachments can either replace whatever was attached before (exclusive) or stack alongside it (multi/BPF_F_ALLOW_MULTI). A cluster running more than one eBPF-based tool at the same hook point relies onmultiattachment; if you see an exclusive attach where you expected two tools to coexist, one of them silently lost its hook.
Command 4: Behavior — What It Actually Does
The first three commands answer what’s loaded, what it remembers, and where it runs. They don’t answer what it does — and that matters when the pinned path is missing, unfamiliar, or you don’t trust it. bpftool prog dump xlated shows the program’s instructions after the verifier’s transformations, in a readable pseudo-assembly.
bpftool prog dump xlated id 142 | head -12
   0: (b7) r0 = 0
   1: (61) r2 = *(u32 *)(r1 +76)
   2: (61) r3 = *(u32 *)(r1 +80)
   3: (bf) r1 = r6
   4: (85) call bpf_skb_load_bytes#26
   5: (16) if w0 == 0x8 goto pc+3
   6: (05) goto pc+9
   7: (61) r1 = *(u32 *)(r6 +0)
   8: (55) r1 != 0x800 goto pc+7
You don’t need to hand-trace every instruction to get value out of this. Look for the helper calls — bpf_skb_load_bytes, bpf_map_lookup_elem, bpf_redirect, bpf_ktime_get_ns — because they name the kernel facilities the program actually touches. A program whose xlated dump is full of bpf_map_lookup_elem and comparison instructions against 0x800 (IPv4’s EtherType) is doing packet classification. One full of bpf_probe_read and bpf_get_current_task is reading process or memory state, not packets — a strong signal you’re looking at an observability or enforcement hook, not a network one, whatever its pinned path claims.
For operators (not writing eBPF): you will not read xlated dumps line by line during an incident. What you’re checking for is much narrower — does the helper call list match what the tool’s marketing says it does? A program that claims to be “read-only observability” but calls
bpf_skb_store_bytes(which writes packet data) is not read-only. That mismatch is worth escalating before you trust the tool’s own dashboard.
⚠ Production Gotchas
bpftool needs CAP_BPF or root, and managed nodes don’t hand that out by default. On EKS and GKE, you typically can’t SSH to a node directly. Use kubectl debug node/<node-name> --image=<image-with-bpftool> -it -- chroot /host to get a privileged shell with host PID and network namespace access, or the cloud provider’s session-manager equivalent (AWS SSM, gcloud compute ssh). Confirm the debug image actually ships bpftool — it’s not in most minimal base images.
Program IDs are node-local and not stable across restarts. ID 142 today may be ID 89 after the node reboots and the DaemonSet reloads its programs. Don’t hardcode IDs in runbooks; always start from bpftool prog show on the specific node and re-derive the ID for that session.
xlated and jited dumps require the kernel to have kept the debug info. Some hardened kernel configs strip CONFIG_BPF_JIT_ALWAYS_ON debug metadata or disable kernel.bpf_stats_enabled, in which case prog dump returns less than shown here. If dumps come back empty, check sysctl kernel.bpf_stats_enabled before assuming the program itself is hiding something.
bpftool cgroup tree only shows attachments below the cgroup you run it from. On a Kubernetes node, run it from the root of the host’s cgroup filesystem (typically after the chroot /host from the debug pod above), not from inside a container’s own cgroup namespace, or you’ll only see a fraction of the attachments.
Pinned paths are a convention, not a guarantee. Nothing stops a tool from pinning under an unexpected path, or not pinning at all. Treat the pinned-path-to-vendor mapping as a strong hint that narrows your investigation, not as ground truth — confirm ownership with the tag (command 1) against the vendor’s published program hashes when it matters for an incident, not just a routine audit.
Quick Reference
| What you want to know | Command |
|---|---|
| What’s loaded | bpftool prog show |
| Program count by type | bpftool prog show -j \| jq -r '.[].type' \| sort \| uniq -c |
| What state a program keeps | bpftool map show id <N> (from map_ids in prog show) |
| Sample map contents | bpftool map dump id <N> \| head |
| Where it’s attached (network) | bpftool net show |
| Where it’s attached (cgroup) | bpftool cgroup tree |
| What it actually does | bpftool prog dump xlated id <N> |
| Confirm identical bytecode across nodes | Compare tag values from prog show |
| Privileged shell on a managed node | kubectl debug node/<name> --image=<img> -it -- chroot /host |
Key Takeaways
- Four
bpftoolcommands audit any eBPF-based tool on any Kubernetes cluster, regardless of vendor:prog show(inventory),map show(state),net show/cgroup tree(attachment),prog dump xlated(behavior) - The kernel tracks loaded programs independently of the userspace agent that loaded them — a program’s pinned path under
/sys/fs/bpf/...usually identifies its owning tool by convention, but that convention is not enforced by the kernel - A program’s
tagis a hash of its bytecode; matching tags across nodes confirm identical program versions without comparing source or vendor documentation map_idsinprog showoutput link directly tobpftool map show, letting you trace from “a program is loaded” to “here’s exactly what data it reads and writes”bpftool net showandcgroup treeanswer where enforcement happens in the packet or syscall path — the same question the opening incident needed answered in ten minutes- When the pinned path and tag aren’t enough,
bpftool prog dump xlatedshows the actual kernel helper calls the program makes, which is the only way to confirm behavior when there’s no documentation to trust
What’s Next
EP14 is the audit playbook — the four commands you run in the first ten minutes on any cluster you’ve inherited, before you trust anything its existing tools tell you about themselves. EP15 goes deeper on one specific case where this matters most: Cilium’s own policy engine telling you traffic is allowed while packets keep dropping. bpftool map dump on the right map — not cilium policy get — is what shows you what’s actually being enforced.
Next: Cilium policy verification — what bpftool shows that cilium policy get doesn’t
Get EP15 in your inbox when it publishes → linuxcent.com/subscribe