eBPF: From Kernel to Cloud, Episode 5
What Is eBPF? · The BPF Verifier · eBPF vs Kernel Modules · eBPF Program Types · eBPF Maps**
Architecture Overview
TL;DR
- eBPF programs are stateless — maps are where all state lives, between invocations and between kernel and userspace
(“stateless” here means each program invocation starts with no memory of previous runs — like a function with no global variables) - Every production eBPF tool (Cilium, Falco, Tetragon, Datadog NPM) is a map-based architecture —
bpftool map listshows you what it’s actually holding - Per-CPU maps eliminate write contention for high-frequency counters; the tool aggregates per-CPU values at export time
- LRU maps handle unbounded key spaces (IPs, PIDs, connections) without hard errors when full — but eviction is silent, so size generously
- Ring buffer (kernel 5.8+) is the correct event streaming primitive — Falco and Tetragon both use it
- Map memory is kernel-locked and invisible to standard memory metrics — account for it explicitly on eBPF-heavy nodes
- Pinned maps survive restarts; Cilium uses this for zero-disruption connection tracking through upgrades
The Big Picture
  HOW eBPF MAPS CONNECT KERNEL PROGRAMS TO USERSPACE TOOLS

  ┌─────────────────────────────────────────────────────────────┐
  │  Kernel space                                               │
  │                                                             │
  │  [XDP program]  [TC program]  [kprobe]  [tracepoint]        │
  │        │              │           │           │             │
  │        └──────────────┴───────────┴───────────┘             │
  │                              │                              │
  │                   bpf_map_update_elem()                     │
  │                              │                              │
  │                              ▼                              │
  │  ┌─────────────────────────────────────────────────────┐    │
  │  │             eBPF MAP (kernel object)                │    │
  │  │  hash · percpu_hash · lru_hash · ringbuf · lpm_trie │    │
  │  │  Lives outside program invocations.                 │    │
  │  │  Pinned maps (/sys/fs/bpf/) survive restarts.       │    │
  │  └────────────────────┬────────────────────────────────┘    │
  └───────────────────────│─────────────────────────────────────┘
                          │  read / write via file descriptor
                          ▼
  ┌─────────────────────────────────────────────────────────────┐
  │  Userspace tools                                            │
  │                                                             │
  │  Cilium agent  Falco engine  Tetragon  bpftool map dump     │
  └─────────────────────────────────────────────────────────────┘
eBPF maps are the persistent data layer between kernel programs and the tools that consume their output. eBPF programs fire and exit — there’s no memory between invocations. Yet Cilium tracks TCP connections across millions of packets, and Falco correlates a process exec from five minutes ago with a suspicious network connection happening now. The mechanism between stateless kernel programs and the stateful production tools you depend on is what this episode is about — and understanding it changes what you see when you run bpftool map list.
I was trying to identify the noisy neighbor saturating a cluster’s egress link. I had an eBPF program loading cleanly, events firing, everything confirming it was working. But when I read back the per-port connection counters from userspace, everything was zero.
I spent an hour on it before posting to the BCC mailing list. The reply came back fast: eBPF programs don’t hold state between invocations. Every time the kprobe fires, the program starts fresh. The counter I was incrementing existed only for that single call — created, incremented to one, then discarded. On every single invocation. I was counting events one at a time, throwing the count away, and reading nothing.
That’s what eBPF maps solve.
Quick Check: What Maps Are Running on Your Node?
Before the map types walkthrough — see the live state of maps on any cluster node right now:
# SSH into a worker node, then:
bpftool map list
On a node running Cilium + Falco, you’ll see something like:
12: hash          name cilium_ct4_glo    key 24B  value 56B  max_entries 65536  memlock 5767168B
13: lpm_trie      name cilium_ipcache    key 40B  value 32B  max_entries 512000 memlock 327680B
14: percpu_hash   name cilium_metrics    key 8B   value 32B  max_entries 65536  memlock 2097152B
28: ringbuf       name falco_events      max_entries 8388608
Reading this output:
– hash, lpm_trie, percpu_hash, ringbuf — the map type (each optimised for a different access pattern)
– key 24B value 56B — sizes of a single entry’s key and value in bytes
– max_entries — the hard ceiling; when the map is full, behaviour depends on type (see LRU section below)
– memlock — non-pageable kernel memory this map consumes (invisible to free and container metrics)
Not running Cilium? On EKS with
aws-vpc-cnior GKE withkubenet, there are far fewer maps here — primarily kube-proxy uses iptables rather than BPF maps. Runningbpftool map liststill works; you’ll just see fewer entries. On a pure iptables-based cluster, most of the maps you see come from the system kernel itself, not a CNI.
Maps Are the Architecture, Not an Afterthought
Maps are kernel objects that live outside any individual program invocation. They’re shared between multiple eBPF programs, readable and writable from userspace, and persistent for the lifetime of the map — which can outlive both the program that created them and the userspace process that loaded them.
Every production eBPF tool is fundamentally a map-based architecture:
- Cilium stores connection tracking state in BPF hash maps
- Falco uses ring buffers to stream syscall events to its userspace rule engine
- Tetragon maintains process tree state across exec events using maps
- Datadog NPM stores per-connection flow stats in per-CPU maps for lock-free metric accumulation
Run bpftool map list on a Cilium node:
$ bpftool map list
ID 12: hash          name cilium_ct4_glo    key 24B  value 56B   max_entries 65536
#      ^^^^           ^^^^^^^^^^^^^^^^       ^^^^^^   ^^^^^^^     ^^^^^^^^^^^^^^^^
#      type           map name               key size value size  max concurrent entries

ID 13: lpm_trie      name cilium_ipcache    key 40B  value 32B   max_entries 512000
#      longest-prefix-match trie — for IP address + CIDR lookups

ID 14: percpu_hash   name cilium_metrics    key 8B   value 32B   max_entries 65536
#      one copy of this map per CPU — no write contention for high-frequency counters

ID 28: ringbuf       name falco_events      max_entries 8388608
#                                           ^^^^^^^^^^^ 8MB ring buffer for event streaming
Connection tracking, IP policy cache, per-CPU metrics, event stream. Every one of these is a different map type, chosen for a specific reason.
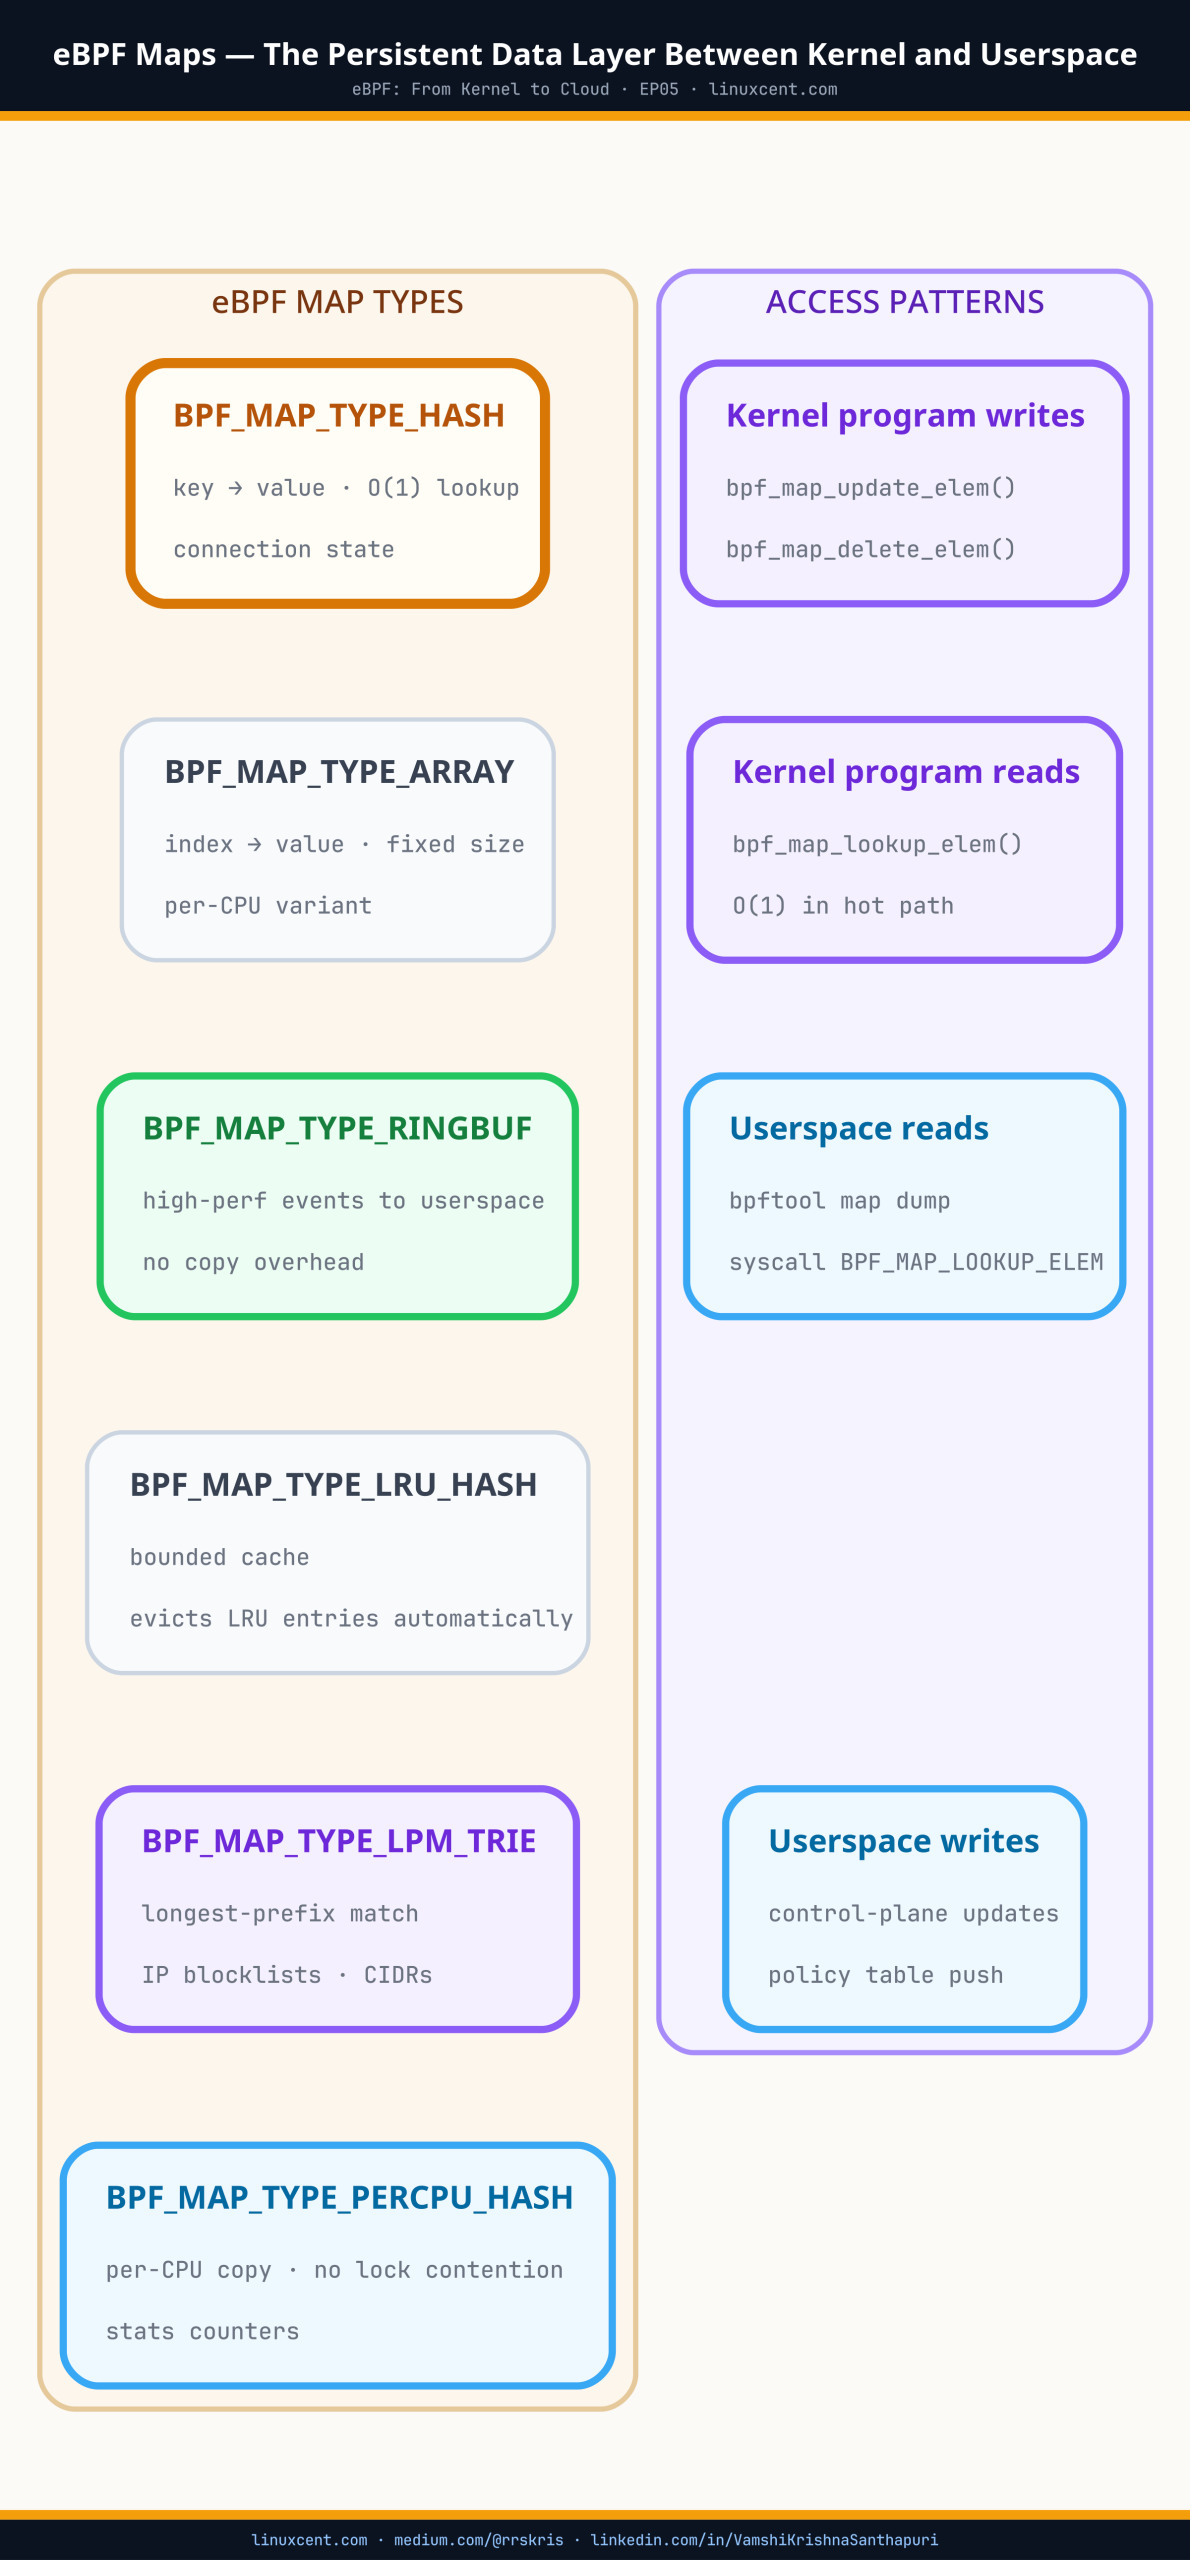
Map Types and What They’re Actually Used For
Hash Maps
The general-purpose key-value store. A key maps to a value — lookup is O(1) average. Cilium’s connection tracking map (cilium_ct4_glo) is a hash map: the key is a 5-tuple (source IP, destination IP, ports, protocol), the value is the connection state.
$ bpftool map show id 12
12: hash  name cilium_ct4_glo  flags 0x0
        key 24B  value 56B  max_entries 65536  memlock 5767168B
The key 24B is the 5-tuple. The value 56B is the connection state record. max_entries 65536 is the upper bound — Cilium can track 65,536 active connections in this map before hitting the limit.
Hash maps are shared across all CPUs on the node. When multiple CPUs try to update the same entry simultaneously — which happens constantly on busy nodes — writes need to be coordinated. For most use cases this is fine. For high-frequency counters updated on every packet, it’s a bottleneck. That’s when you reach for a per-CPU hash map.
Where you see them: connection tracking, per-IP statistics, process-to-identity mapping, policy verdict caching.
Per-CPU Hash Maps
Per-CPU hash maps solve the write coordination problem by giving each CPU its own independent copy of every entry. There’s no sharing, no contention, no waiting — each CPU writes its own copy without touching any other.
The tradeoff: reading from userspace means collecting one value per CPU and summing them up. That aggregation happens in the tool, not the kernel.
# Cilium's per-CPU metrics map — one counter value per CPU
bpftool map dump id 14
key: 0x00000001
  value (CPU 00): 12345
  value (CPU 01): 8901
  value (CPU 02): 3421
  value (CPU 03): 7102
# total bytes for this metric: 31769
Cilium’s cilium_metrics map uses this pattern for exactly this reason — it’s updated on every packet across every CPU on the node. Forcing all CPUs to coordinate writes to a single shared entry at that rate would hurt throughput. Instead: each CPU writes locally, Cilium’s userspace agent sums the values at export time.
Where you see them: packet counters, byte counters, syscall frequency metrics — anywhere updates happen on every event at high volume.
LRU Hash Maps
LRU hash maps add automatic eviction. Same key-value semantics as a regular hash map, but when the map hits its entry limit, the least recently accessed entry is dropped to make room for the new one.
This matters for any map tracking dynamic state with an unpredictable number of keys: TCP connections, process IDs, DNS queries, pod IPs. Without LRU semantics, a full map returns an error on insert — and in production, that means your tool silently stops tracking new entries. Not a crash, not an alert — just missing data.
Cilium’s connection tracking map is LRU-bounded at 65,536 entries. On a node handling high-connection-rate workloads, this can fill up. When it does, Cilium starts evicting old connections to make room for new ones — and if it’s evicting too aggressively, you’ll see connection resets.
# Check current CT map usage vs its limit
bpftool map show id 12
# max_entries tells you the ceiling
# count entries to see current usage
bpftool map dump id 12 | grep -c "^key"
Size LRU maps at 2× your expected concurrent active entries. Aggressive eviction under pressure introduces gaps — not crashes, but missing or incorrect state.
Where you see them: connection tracking, process lineage, anything where the key space is dynamic and unbounded.
Ring Buffers
Ring buffers are how eBPF tools stream events from the kernel to a userspace consumer. Falco reads syscall events from a ring buffer. Tetragon streams process execution and network events through ring buffers. The pattern is the same across all of them:
kernel eBPF program
  → sees event (syscall, network packet, process exec)
  → writes record to ring buffer
  → userspace tool reads it and processes (Falco rules, Tetragon policies)
What makes ring buffers the right primitive for event streaming:
- Single buffer shared across all CPUs — unlike the older
perf_event_arrayapproach which required one buffer per CPU, a ring buffer is one allocation, one file descriptor, one consumer - Lock-free — the kernel writes, the userspace tool reads, they don’t block each other
- Backpressure when full — if the userspace tool can’t keep up, new events are dropped rather than queued indefinitely. The tool can detect and count drops. Falco reports these as
Dropped eventsin its stats output.
# Falco's ring buffer — 8MB
bpftool map list | grep ringbuf
# ID 28: ringbuf  name falco_events  max_entries 8388608
8,388,608 bytes = 8MB. That’s the buffer between Falco’s kernel hooks and its rule engine. If there’s a burst of syscall activity and Falco’s rule evaluation can’t keep up, events drop into that window and are lost.
Sizing matters operationally. Too small and you drop events during normal burst. Too large and you’re holding non-pageable kernel memory that doesn’t show up in standard memory metrics.
# Check Falco's drop rate
falcoctl stats
# or check the Falco logs
journalctl -u falco | grep -i "drop"
Most production deployments run 8–32MB. Start at 8MB, monitor drop rates under load, size up if needed.
Where you see them: Falco event streaming, Tetragon audit events, any tool that needs to move high-volume event data from kernel to userspace.
Array Maps
Array maps are fixed-size, integer-indexed, and entirely pre-allocated at creation time. Think of them as lookup tables with integer keys — constant-time access, no hash overhead, no dynamic allocation.
Cilium uses array maps for policy configuration: a fixed set of slots indexed by endpoint identity number. When a packet arrives and Cilium needs to check policy, it indexes into the array directly rather than doing a hash lookup. For read-heavy, write-rare data, this is faster.
The constraint: you can’t delete entries from an array map. Every slot exists for the lifetime of the map. If you need to track state that comes and goes — connections, processes, pods — use a hash map instead.
Where you see them: policy configuration, routing tables with fixed indices, per-CPU stats indexed by CPU number.
LPM Trie Maps
LPM (Longest Prefix Match) trie maps handle IP prefix lookups — the same operation that a hardware router does when deciding which interface to send a packet out of.
You can store a mix of specific host addresses (/32) and CIDR ranges (/16, /24) in the same map, and a lookup returns the most specific match. If 10.0.1.15/32 and 10.0.0.0/8 are both in the map, a lookup for 10.0.1.15 returns the /32 entry.
Cilium’s cilium_ipcache map is an LPM trie. It maps every IP in the cluster to its security identity — the identifier Cilium uses for policy enforcement. When a packet arrives, Cilium does a trie lookup on the source IP to find out which endpoint sent it, then checks policy against that identity.
# Inspect the ipcache map
bpftool map show id 13
# lpm_trie  name cilium_ipcache  key 40B  value 32B  max_entries 512000

# Look up which security identity owns a pod IP
bpftool map lookup id 13 key hex 20 00 00 00 0a 00 01 0f 00 00 00 00 00 00 00 00 00 00 00 00
Where you see them: IP-to-identity mapping (Cilium), CIDR-based policy enforcement, IP blocklists.
Pinned Maps — State That Survives Restarts
By default, a map’s lifetime is tied to the tool that created it. When the tool exits, the kernel garbage-collects the map.
Pinning writes a reference to the BPF filesystem at /sys/fs/bpf, which keeps the map alive even after the creating process exits:
# See all maps Cilium has pinned
ls /sys/fs/bpf/tc/globals/
# cilium_ct4_global  cilium_ipcache  cilium_metrics  cilium_policy ...

# Inspect a pinned map directly — no Cilium process needed
bpftool map dump pinned /sys/fs/bpf/tc/globals/cilium_ct4_global

# Pin any map by ID for manual inspection
bpftool map pin id 12 /sys/fs/bpf/my_conn_tracker
bpftool map dump pinned /sys/fs/bpf/my_conn_tracker
Cilium pins all its maps under /sys/fs/bpf/tc/globals/. When Cilium restarts — rolling upgrade, crash, OOM kill — it reopens its pinned maps and resumes with existing state intact. Pods maintain established TCP connections through a Cilium restart without disruption.
This is operationally significant: if you’re evaluating eBPF-based tools for production, check whether they pin their maps. A tool that doesn’t loses all its tracked state on every restart — connection tracking resets, process lineage gaps, policy state rebuilt from scratch.
Map Memory: A Production Consideration
Map memory is kernel-locked — it cannot be paged out, and it doesn’t show up in standard memory pressure metrics. Your node’s free output and container memory limits don’t account for it.
Kernel-locked memory is memory the OS guarantees will never be swapped to disk — it stays in RAM permanently. The kernel requires this for eBPF maps because a kernel program running during a network interrupt cannot wait for a page fault. The side effect: it doesn’t appear in
top,free, or container memory metrics, so it’s easy to accidentally provision nodes without accounting for it.
# Total eBPF map memory locked on this node
bpftool map list -j | python3 -c "
import json,sys
maps=json.load(sys.stdin)
total=sum(m.get('bytes_memlock',0) for m in maps)
print(f'Total map memory: {total/1024/1024:.1f} MB')
"

# Check system memlock limit (unlimited is correct for eBPF tools)
ulimit -l

# Check what Cilium's systemd unit sets
systemctl show cilium | grep -i memlock
On a node running Cilium + Falco + Datadog NPM, I’ve seen 200–400MB of map memory locked. That’s real, non-pageable kernel memory. If you’re sizing nodes for eBPF-heavy workloads, account for this separately from your pod workload memory.
If an eBPF tool fails to load with a permission error despite having enough free memory, the root cause is usually the memlock ulimit for the process. Cilium, Falco, and most production tools set LimitMEMLOCK=infinity in their systemd units. Verify this if you’re deploying a new eBPF-based tool and seeing unexpected load failures.
Inspecting Maps in Production
# List all maps: type, name, key/value sizes, memory usage
bpftool map list

# Dump all entries in a map (careful with large maps)
bpftool map dump id 12

# Look up a specific entry by key
bpftool map lookup id 12 key hex 0a 00 01 0f 00 00 00 00

# Watch map stats live
watch -n1 'bpftool map show id 12'

# See all maps for a specific tool by checking its pinned path
ls /sys/fs/bpf/tc/globals/                    # Cilium
ls /sys/fs/bpf/falco/                         # Falco (if pinned)

# Cross-reference map IDs with the programs using them
bpftool prog list
bpftool map list
⚠ Production Gotchas
A full LRU map drops state silently, not loudly
When Cilium’s CT map fills up, it starts evicting the least recently used connections — not returning an error. You see connection resets, not a tool alert. Check map utilisation (bpftool map dump id X | grep -c key) against max_entries on nodes with high connection rates.
Ring buffer drops don’t stop the tool — they create gaps
When Falco’s ring buffer fills up, events are dropped. Falco keeps running. The rule engine keeps processing. But you have gaps in your syscall visibility. Monitor Dropped events in Falco’s stats and size the ring buffer accordingly.
Map memory is invisible to standard monitoring
200–400MB of kernel-locked memory on a Cilium + Falco node doesn’t appear in top, container memory metrics, or memory pressure alerts. Size eBPF-heavy nodes with this in mind and add explicit map memory monitoring via bpftool.
Tools that don’t pin their maps lose state on restart
A Cilium restart with pinned maps = zero-disruption connection tracking. A tool without pinning = all tracked state rebuilt from scratch. This matters for connection tracking tools and any tool maintaining process lineage.
perf_event_array on kernel 5.8+ is the old way
Older eBPF tools use per-CPU perf_event_array for event streaming. Ring buffer is strictly better — single allocation, lower overhead, simpler consumption. If you’re running a tool that still uses perf_event_array on a 5.8+ kernel, it’s using a legacy path.
Key Takeaways
- eBPF programs are stateless — maps are where all state lives, between invocations and between kernel and userspace
- Every production eBPF tool (Cilium, Falco, Tetragon, Datadog NPM) is a map-based architecture —
bpftool map listshows you what it’s actually holding - Per-CPU maps eliminate write contention for high-frequency counters; the tool aggregates per-CPU values at export time
- LRU maps handle unbounded key spaces (IPs, PIDs, connections) without hard errors when full — but eviction is silent, so size generously
- Ring buffer (kernel 5.8+) is the correct event streaming primitive — Falco and Tetragon both use it
- Map memory is kernel-locked and invisible to standard memory metrics — account for it explicitly on eBPF-heavy nodes
- Pinned maps survive restarts; Cilium uses this for zero-disruption connection tracking through upgrades
What’s Next
You know what program types run in the kernel, and you know how they hold state.
Get EP06 in your inbox when it publishes → linuxcent.com/subscribe But there’s a problem anyone running eBPF-based tools eventually runs into: a tool works on one kernel version and breaks on the next. Struct layouts shift between patch versions. Field offsets move. EP06 covers CO-RE (Compile Once, Run Everywhere) and libbpf — the mechanism that makes tools like Cilium and Falco survive your node upgrades without recompilation, and why kernel version compatibility is a solved problem for any tool built on this toolchain.