eBPF: From Kernel to Cloud, Episode 12
What Is eBPF? · The BPF Verifier · eBPF vs Kernel Modules · eBPF Program Types · eBPF Maps · CO-RE and libbpf · XDP · TC eBPF · bpftrace · Network Flow Observability · DNS Observability · LSM and Tetragon
TL;DR
- LSM eBPF Tetragon integrates Linux Security Module hooks with eBPF programs — enforcement happens at the syscall boundary, before the operation completes, with no detect-and-respond window
(LSM hook = Linux Security Module hook: a callback point built into the kernel that fires before a security-relevant operation completes, allowing the security module to approve or reject it) - Falco and similar sidecar-based tools detect after the fact — the syscall returns, the file is written, the connection is established, the alert fires; with LSM, the syscall never returns success
BPF_PROG_TYPE_LSMis the eBPF program type that attaches to LSM hooks — introduced in kernel 5.7, stable in 5.10+; available on all current Ubuntu LTS, Fedora, and EKS/GKE nodes- Tetragon attaches eBPF programs to LSM hooks and kprobes simultaneously — observing and enforcing from the same kernel attachment point
- Tetragon’s enforcement sends
SIGKILLfrom within the kernel context — not from a userspace agent reading an audit log and then killing the process - Production caution: LSM enforce mode without thorough policy testing in audit mode first will kill legitimate workloads; always audit before enforce
EP11 showed how to observe DNS queries at the kernel level — seeing what a workload resolves before it establishes a connection. But observation is passive. It tells you what happened. LSM eBPF Tetragon changes the question entirely: instead of watching the workload, the kernel refuses the operation. This episode covers how that enforcement layer works and why the difference between “detect” and “prevent” matters in runtime security.
Quick Check: Is Your Cluster Running LSM-Based Enforcement?
# On any cluster node — what security modules are active?
cat /sys/kernel/security/lsm

# Expected output on a modern kernel:
# lockdown,capability,landlock,yama,apparmor,bpf
#                                              ^^^
#                            "bpf" here means BPF LSM is enabled
# Is Tetragon running on this cluster?
kubectl get pods -n kube-system -l app.kubernetes.io/name=tetragon

# If Tetragon is present, check what TracingPolicies are enforcing:
kubectl get tracingpolicies -A

# Sample output:
# NAMESPACE    NAME                      AGE
# kube-system  block-privileged-exec     3d
# kube-system  restrict-sensitive-paths  3d
# See what eBPF programs Tetragon has loaded
bpftool prog list | grep -i tetragon

# Output sample:
# 89: lsm  name tetragon_lsm_bprm  tag 8f2a1c3e4d5b7a9f  gpl
#     loaded_at 2026-04-22T09:13:45+0530  uid 0
#     xlated 3312B  jited 2184B  memlock 8192B
# 91: kprobe  name tetragon_kp_exec tag 3c1d8e2f7a4b5c9d  gpl
lsm program type confirms LSM hook attachment. If you see tetragon_lsm_* entries, Tetragon is enforcing at the kernel level on this node.
Not running Tetragon? Check if your cluster uses AppArmor or seccomp profiles instead —
kubectl get pod <name> -o jsonpath='{.metadata.annotations}'and look forseccomp.security.alpha.kubernetes.ioorcontainer.apparmor.security.beta.kubernetes.ioannotations. These are userspace-applied profiles that the kernel enforces. Tetragon is additive — it can run alongside AppArmor/seccomp and provides per-process, dynamic policy that static profiles cannot.
Falco fired at 03:14 AM. The alert: a process inside a production container had opened /etc/passwd for writing. By the time I was on the call, the container had been restarted by a health check failure — the compromised process had already exited. The file had already been modified. Falco had detected the open, emitted the alert, and by the time any automated response could have acted, the syscall had returned, the write had completed, and the file was changed.
Falco did exactly what it’s designed to do: observe and alert. The gap isn’t in Falco — it’s in the architecture. When a tool detects from userspace by reading kernel audit events, there is always a window between the operation completing and the alert firing. For a fast exploit, that window is the entire attack.
I added a Tetragon TracingPolicy the following week:
spec:
  kprobes:
    - call: "security_inode_permission"
      syscall: false
      return: false
      args:
        - index: 0
          type: "inode"
      selectors:
        - matchArgs:
            - index: 0
              operator: "Prefix"
              values: ["/etc/passwd", "/etc/shadow"]
          matchActions:
            - action: Sigkill
Next time a process tries to open /etc/passwd for writing in a container covered by that policy, the kernel sends SIGKILL from within the LSM hook. The open never completes. There is no window.
How LSM Hooks Are Placed in the Kernel
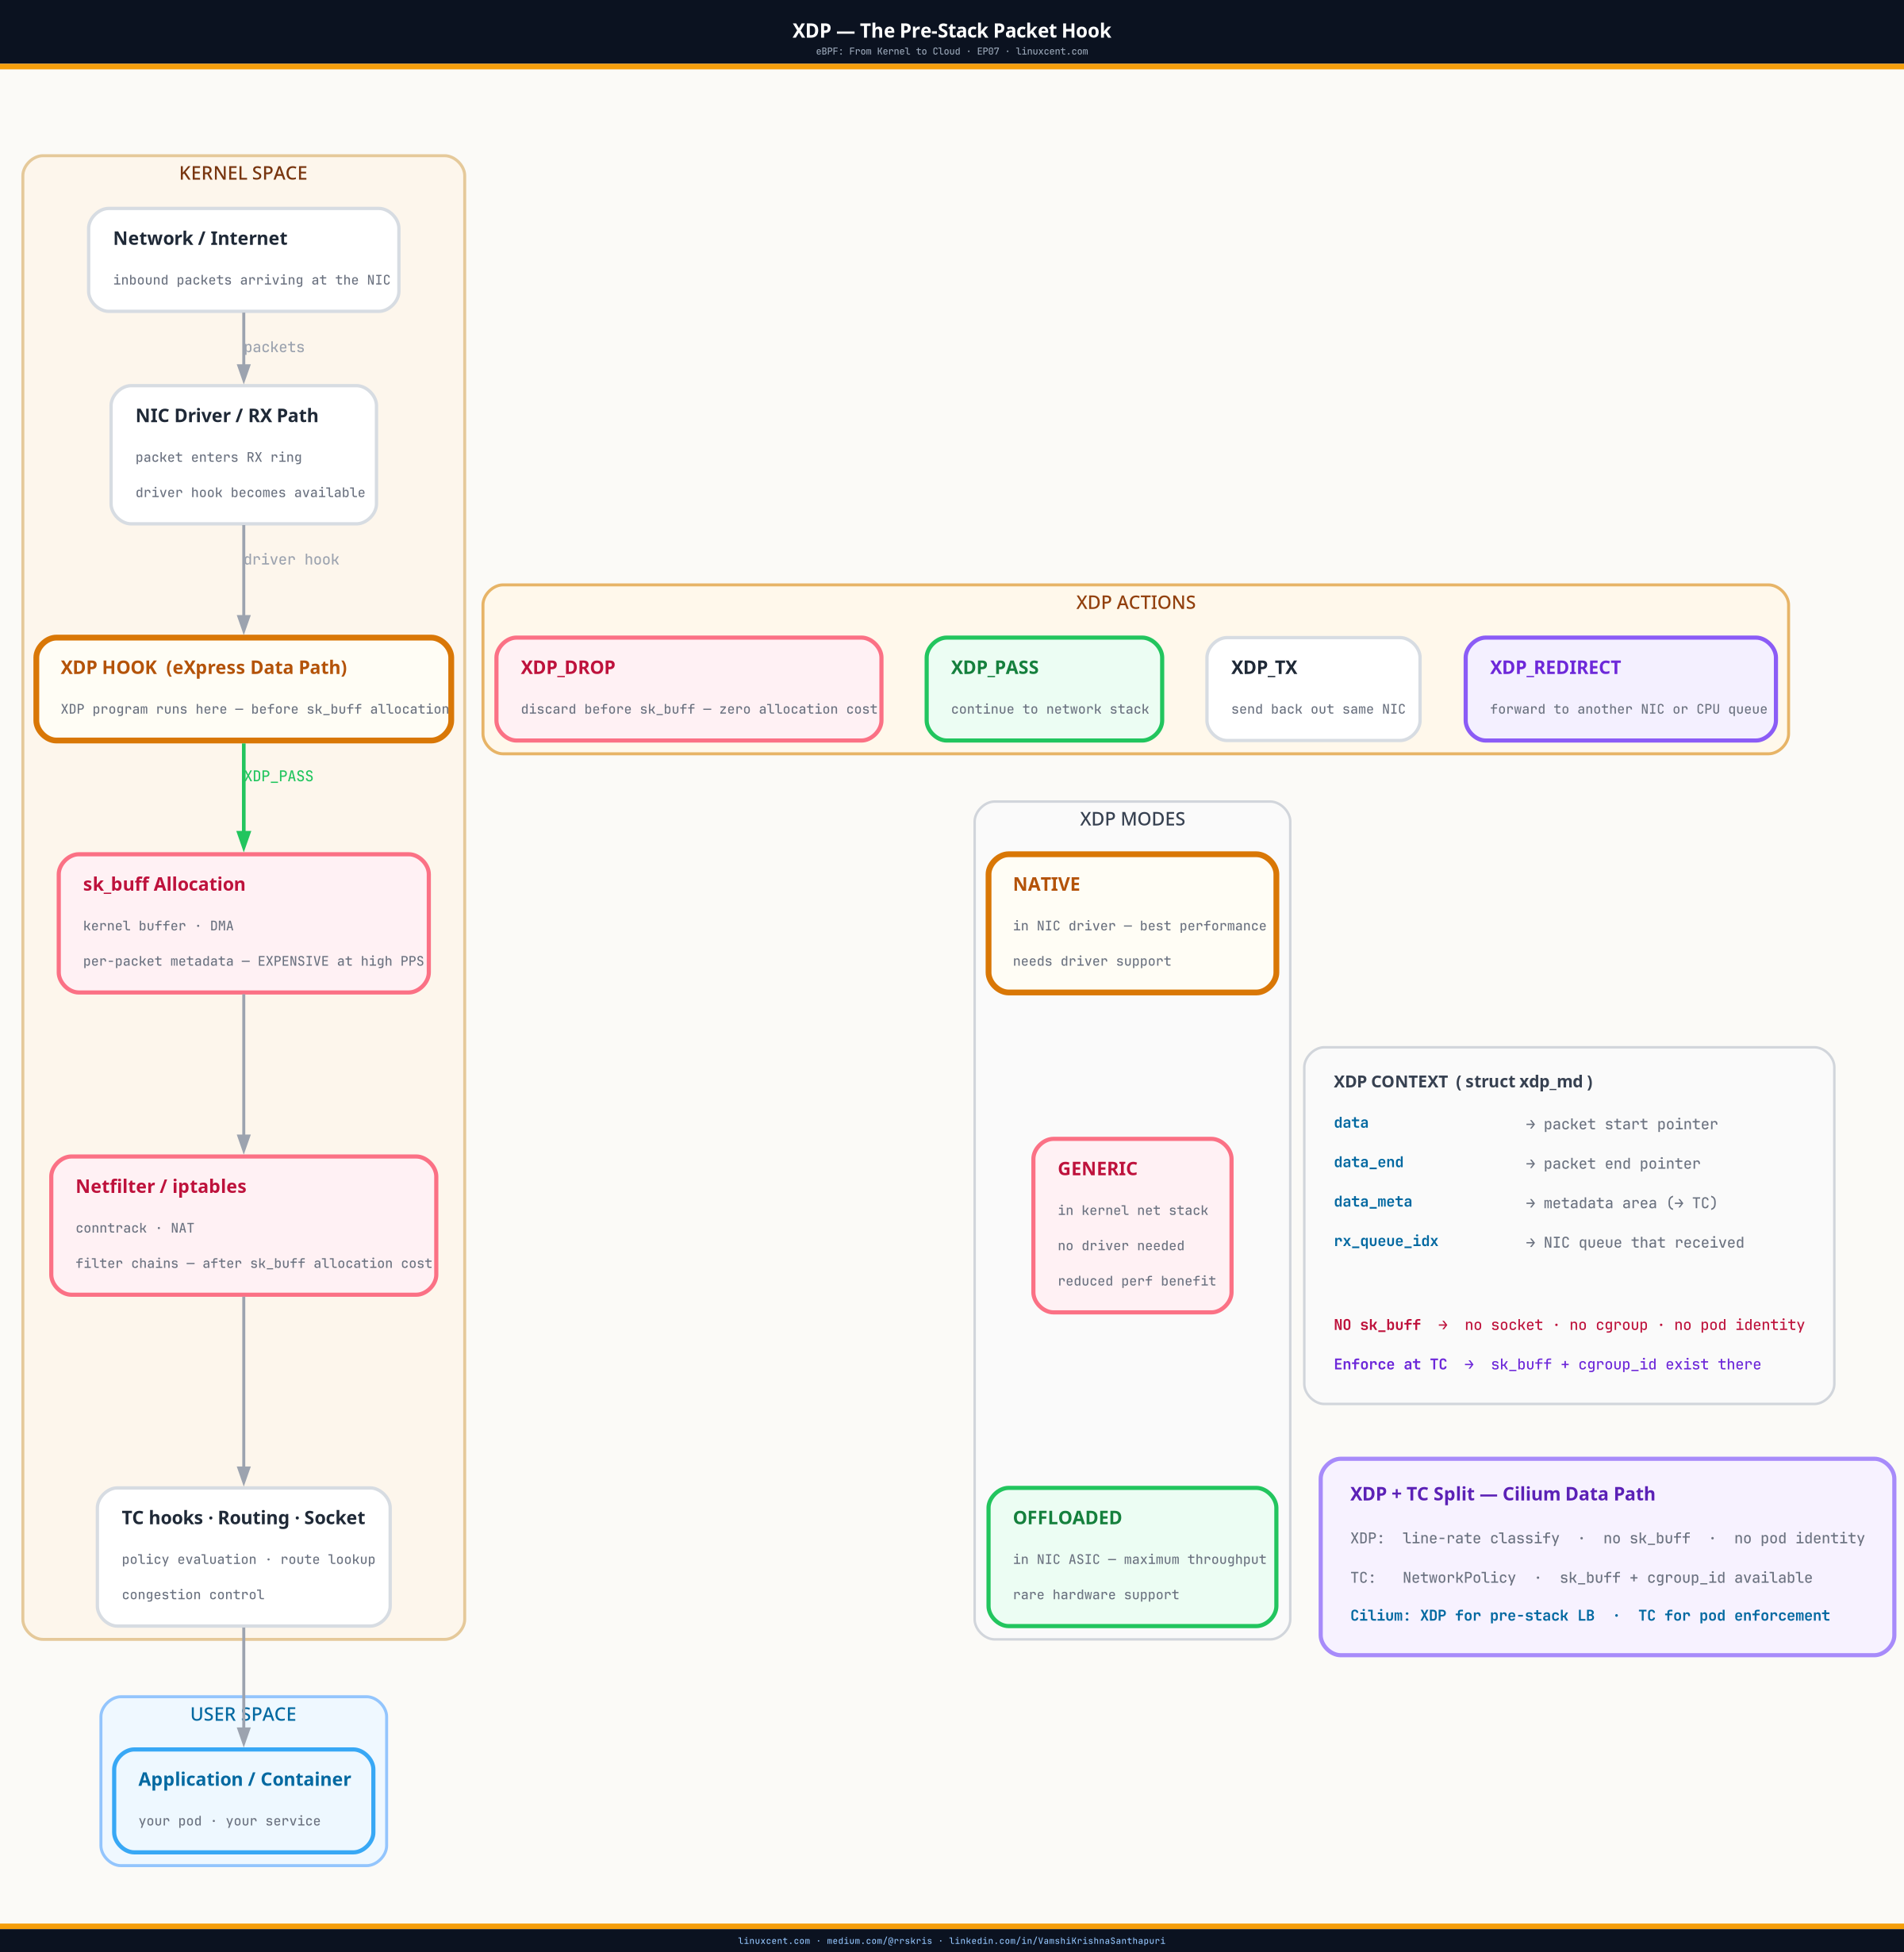
Linux Security Modules (LSM) is a framework built into the Linux kernel that inserts hook points before security-sensitive operations. The hook fires before the operation is allowed to complete — the LSM module can return an error code that causes the kernel to reject the operation and return -EPERM to the calling process.
Process calls open("/etc/passwd", O_WRONLY)
      ↓
VFS (Virtual Filesystem) layer receives the request
      ↓
VFS calls security_inode_permission()   ← LSM hook fires here
      ↓
LSM module checks policy
      ↓
      ├── ALLOW → open() proceeds, file descriptor returned
      └── DENY  → open() returns -EPERM, process gets "Permission denied"
                  File is never touched
LSM hook— a callback point embedded in Linux kernel source at every security-sensitive operation: file open, execute, socket connect, capability check, mount, ptrace, and more. The kernel calls registered LSM modules at each hook. Before BPF LSM (kernel 5.7), only statically compiled security modules (SELinux, AppArmor, BPF LSM itself) could register at these hooks.
BPF_PROG_TYPE_LSM— the eBPF program type that attaches to LSM hooks. Introduced in kernel 5.7. Requires BPF LSM to be enabled in the kernel (lsm=bpfin kernel command line, or present alongside other LSMs). When this program type is loaded and attached to an LSM hook, the eBPF program runs at the hook point and returns 0 (allow) or a negative error code (deny).
The full list of LSM hooks:
# All LSM hook points available for eBPF attachment
bpftool feature list | grep lsm_hook | head -20

# Or browse the kernel source list:
# include/linux/security.h — every security_*() function is an LSM hook point
There are 200+ LSM hook points. The most operationally relevant for container security:
| LSM Hook | What it guards |
|---|---|
security_bprm_check |
Process execution (execve) |
security_inode_permission |
File read/write/execute |
security_inode_create |
File creation |
security_socket_connect |
Outbound TCP/UDP connect |
security_socket_bind |
Port binding |
security_ptrace_access_check |
ptrace (debugger attach) |
security_capable |
Capability checks (CAP_SYS_ADMIN etc.) |
How Tetragon Combines LSM and kprobe
Tetragon attaches two types of programs simultaneously for comprehensive runtime security:
kprobe programs          LSM programs
(observation layer)      (enforcement layer)
       │                        │
       ↓                        ↓
Process executes              Kernel LSM hook fires
kernel function               BEFORE operation completes
       │                        │
       ↓                        ↓
Tetragon reads context:       Tetragon checks TracingPolicy:
  - process name                - selectors match?
  - PID, UID                    - action = Sigkill?
  - namespace, pod name         │
  - parent process              ↓
  - capabilities                SIGKILL sent from kernel context
       │                        Process terminated
       ↓                        Operation never completes
Tetragon exports event
  to userspace observer
The kprobe side provides the rich context (pod name, namespace, process tree) because it has access to Kubernetes metadata that Tetragon’s userspace component has pre-populated into maps. The LSM side provides the enforcement capability. Together, they give you context-aware kernel enforcement.
SIGKILLfrom kernel vs userspace kill — When a userspace process runskill -9 <pid>, it issues a kill syscall, the kernel schedules the signal delivery, and the target process dies on its next scheduler timeslice. There is a measurable delay — and more importantly, the target process may run for several more instructions before the signal is delivered. When a BPF LSM program returns a non-zero error code or callsbpf_send_signal(SIGKILL)from within the hook, the signal is delivered synchronously within the kernel’s execution context. The process does not execute another instruction in the problematic syscall. This is not a speed difference — it is a structural difference in when the enforcement happens relative to the operation.
Writing a Tetragon TracingPolicy for Enforcement
Tetragon policies are Kubernetes custom resources. Here’s a policy that prevents any container from executing shells:
apiVersion: cilium.io/v1alpha1
kind: TracingPolicy
metadata:
  name: block-shell-exec
spec:
  kprobes:
    - call: "security_bprm_check"
      syscall: false
      args:
        - index: 0
          type: "linux_binprm"
      selectors:
        - matchBinaries:
            - operator: "In"
              values:
                - "/bin/sh"
                - "/bin/bash"
                - "/bin/dash"
                - "/usr/bin/sh"
                - "/usr/bin/bash"
          matchNamespaces:
            - namespace: Pid
              operator: "NotIn"
              values: ["1"]      # exclude host namespace (PID 1 = init)
          matchActions:
            - action: Sigkill
              argError: -1       # EPERM returned to the caller
Apply and verify:
kubectl apply -f block-shell-exec.yaml

# Confirm it's active
kubectl get tracingpolicies
# NAME               ENABLED   REASON   AGE
# block-shell-exec   true               5s

# Verify Tetragon loaded the eBPF program for this policy
bpftool prog list | grep bprm
# 94: lsm  name tetragon_lsm_bprm  tag 8f2a1c3e4d5b7a9f  gpl
#     loaded_at 2026-04-22T14:22:13+0530  uid 0
Test it (in a non-production namespace):
kubectl exec -it test-pod -- /bin/sh

# Expected output:
# OCI runtime exec failed: exec failed: unable to start container process:
# error during container init: error starting executable ["/bin/sh"]:
# container_linux.go: ... starting container process caused: process_linux.go:
# ... SIGKILL
The shell never started. The security_bprm_check LSM hook fired, the Tetragon eBPF program evaluated the policy, returned SIGKILL from kernel space. The exec system call returned -EPERM to the container runtime. No shell process was created.
Audit Mode Before Enforce Mode
Running a new LSM policy in enforce mode without prior testing will kill legitimate workloads. Tetragon supports audit mode for every policy:
          matchActions:
            - action: Post     # audit mode: log event, do NOT kill
Post emits a Tetragon event that you can observe:
# Watch audit events for the policy (before switching to Sigkill)
kubectl exec -n kube-system -it \
  $(kubectl get pod -n kube-system -l app.kubernetes.io/name=tetragon -o name | head -1) \
  -- tetra getevents --event-types PROCESS_KPROBE | grep bprm
Sample audit event:
{
  "process_kprobe": {
    "process": {
      "pod": {"name": "my-app-6d4f9-xk2p1", "namespace": "production"},
      "binary": "/bin/sh",
      "pid": 18293
    },
    "function_name": "security_bprm_check",
    "action": "KPROBE_ACTION_POST"
  }
}
If my-app legitimately needs /bin/sh for its health check script, you’ll see it here before you kill it. Refine the selector (add matchLabels to exclude that specific deployment, or add the binary to an allowlist) and then switch to Sigkill.
⚠ Production Gotchas
Enforce mode kills anything the selector matches — including health checks and init containers. Most production containers have some shell usage: liveness probes that run sh -c, init containers that chmod files, entrypoint wrappers. Run in Post (audit) mode for at least 48 hours across a representative workload set before switching to Sigkill. Track all matched events and understand every process in the trace before enforcing.
LSM hooks fire in kernel context — eBPF program complexity is limited. The verifier enforces strict limits on LSM programs because they run synchronously in the kernel’s hot path. Policies with many conditions or complex map lookups may be rejected by the verifier. Tetragon’s policy engine compiles your TracingPolicy into eBPF that stays within verifier limits, but very complex matchArgs chains with many values can hit limits. Test with kubectl apply and check Tetragon pod logs for verifier rejection messages.
BPF_PROG_TYPE_LSM requires kernel 5.7+ and BPF LSM enabled. Check /sys/kernel/security/lsm for bpf in the list. EKS nodes running Amazon Linux 2 with kernel 5.10+ have BPF LSM available. GKE nodes with kernel 5.10+ on Container-Optimized OS have it enabled. Ubuntu 22.04 (kernel 5.15) has it enabled by default. Ubuntu 20.04 kernels before 5.7 do not — check your actual kernel version.
Policy scope: Tetragon TracingPolicies are cluster-wide by default. A policy without a matchNamespaces or matchLabels selector applies to every pod on every node. Start with namespace-scoped policies during testing. Use namespaced TracingPolicy resources (Tetragon 0.10+) to limit scope to a specific namespace.
bpf_send_signal(SIGKILL) vs returning an error code. Tetragon’s Sigkill action uses bpf_send_signal() rather than returning a negative error from the LSM hook. This means the syscall may return before the signal is delivered — there can be a single instruction window. For critical enforcement paths, combining LSM deny (return -EPERM) with bpf_send_signal(SIGKILL) is the belt-and-suspenders approach; Tetragon’s maintainers have documented which actions use which mechanism.
Quick Reference
| What you want | Command |
|---|---|
| Is BPF LSM enabled? | cat /sys/kernel/security/lsm (look for bpf) |
| What LSM programs are loaded? | bpftool prog list | grep lsm |
| What Tetragon policies exist? | kubectl get tracingpolicies -A |
| Audit events (before enforce) | tetra getevents --event-types PROCESS_KPROBE |
| Watch Tetragon enforcement | kubectl logs -n kube-system -l app.kubernetes.io/name=tetragon -f |
| Test a policy safely | Set action: Post before action: Sigkill |
| Tetragon action | Effect |
|---|---|
Post |
Log event only — audit mode |
Sigkill |
Send SIGKILL from kernel context |
Override |
Return custom error code to syscall caller |
FollowFD |
Track file descriptor for future hook correlation |
| LSM hook | Protects |
|---|---|
security_bprm_check |
exec (block shell spawning) |
security_inode_permission |
file access (block reads/writes to sensitive paths) |
security_socket_connect |
outbound connections (block C2 connections) |
security_capable |
capability escalation (block CAP_SYS_ADMIN attempts) |
Key Takeaways
- LSM eBPF Tetragon enforces at the syscall boundary — the operation either never completes or returns an error before the kernel performs the action, with no detect-and-respond window
- Falco, Datadog, and sidecar-based tools detect events after the syscall returns; this is architectural, not a product limitation — they operate at a layer where the operation has already occurred
BPF_PROG_TYPE_LSMattaches eBPF programs directly to Linux Security Module hooks; available on kernel 5.7+, enabled on all current EKS/GKE LTS node images- Tetragon sends
SIGKILLfrom kernel context usingbpf_send_signal()— not from a userspace agent polling an audit log - Always run Tetragon policies in
Post(audit) mode for 48+ hours before switching toSigkill— legitimate workloads trigger many of the same LSM hooks that attacks use - The combination of kprobe (rich context: pod name, namespace, process tree) and LSM (enforcement) gives Tetragon context-aware kernel enforcement that static profiles (AppArmor, seccomp) cannot provide dynamically
What’s Next
LSM hooks prevent operations in the moment. But after an incident — when enforcement failed, or when you’re doing post-hoc forensics — the question changes: what did this process spawn, what files did it touch, what connections did it make, and in what order? Answering that from logs alone is guesswork. Answering it from kernel-level process lineage is reconstruction.
EP13 covers how eBPF kprobe hooks on fork and exec build a complete, tamper-resistant process tree. Even after the attacker’s process has exited, the record remains — in kernel maps, exported to a persistent store, tied to the pod that ran it.
Next: process lineage with eBPF — reconstructing what happened after the fact
Get EP13 in your inbox when it publishes → linuxcent.com/subscribe